


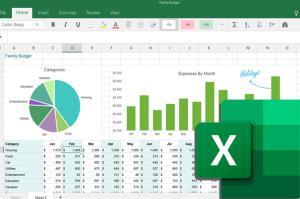
Excel Chart
Microsoft Excel 是一種方便而強大的圖表創建工具。圖表的圖形特性吸引了注意力,幫助讀者更好地理解數據趨勢和分析。本課程演示如何通過使用圖表有效地傳達和可視化數據。
Microsoft Excel is a convenient and powerful tool to create charts. The graphical nature of a chart attracts attention and help readers understand data trends and analyses better. This course demonstrates how data can be communicated and visualized effectively through the use of charts.
- 基本圖表創建及圖表類型
- 圖表格式和修改
- 圖表設計和模板
- Basic charts creation and their types
- Chart formats and modifications
- Chart designs and templates
圖表是一種以圖形方式呈現數據分析結果或市場趨勢的強大工具。本課程專為想要掌握 Excel 圖表製作功能的同學而設計。完成本課程將使您能夠創建不同類型的圖表,並使用各種技術來構建具有專業外觀的圖表。您還將學習如何利用多個組合圖表來提高數據展示的有效性。
A chart is a powerful tool to graphically present the results of data analysis or market trends. This course is specially designed for those who want to master Excel’s chart creation features. Completing the course will enable you to create different types of charts and use a variety of techniques to build charts with a professional look. You will also learn how to make use of multiple combination charts to enhance data presentation effectiveness.
學員修畢課程會獲頒修業證書。

課程費用無須申請任何政府基金資助。
本課程的凝方網校 (線上學習) 版本現正努力開發中!期間你的面授課程仍會有優良的導師和教材的支援,也有靈活的免費補課務求讓你學有所成!
面授時間表 | 留位報名
系統預設展示和收取為全期學費。如果有相關的優惠和顯示的金額不同,請在結帳時選擇 “到校付款”,我們的客戶服務主任很樂意為閣下辦理。
| Course No. 課程編號 | Info. 語言/系統/地點 | Start 開課日 | End 完課日 | Day(s) 上課日 | Time 上課時段 | Duration 課程長度 | Enrol 報名 |
|---|
課程大綱


客製課程 | 企業培訓
本課程歡迎機構和企業報讀,亦可按閣下需要客製你所需的培訓,歡迎使用以下表格聯絡我們